Signals
A market intelligence tool identifying emerging players in the direct-to-consumer (DTC) commerce landscape
Signals is Rakuten Intelligence’s first B2B solution, designed to help big brands or investors identify emerging players in direct-to-consumer commerce. By analyzing trends in email receipts from our shopper panel, Signals can uncover rising stars—spotting the next "Dollar Shave Club" before it reaches prominence.
Company:
Rakuten Intelligence
Role:
Design Lead & Product Co-owner
Team:
1 Designer, 1 PM, 8 Engineers
Project Year:
2018
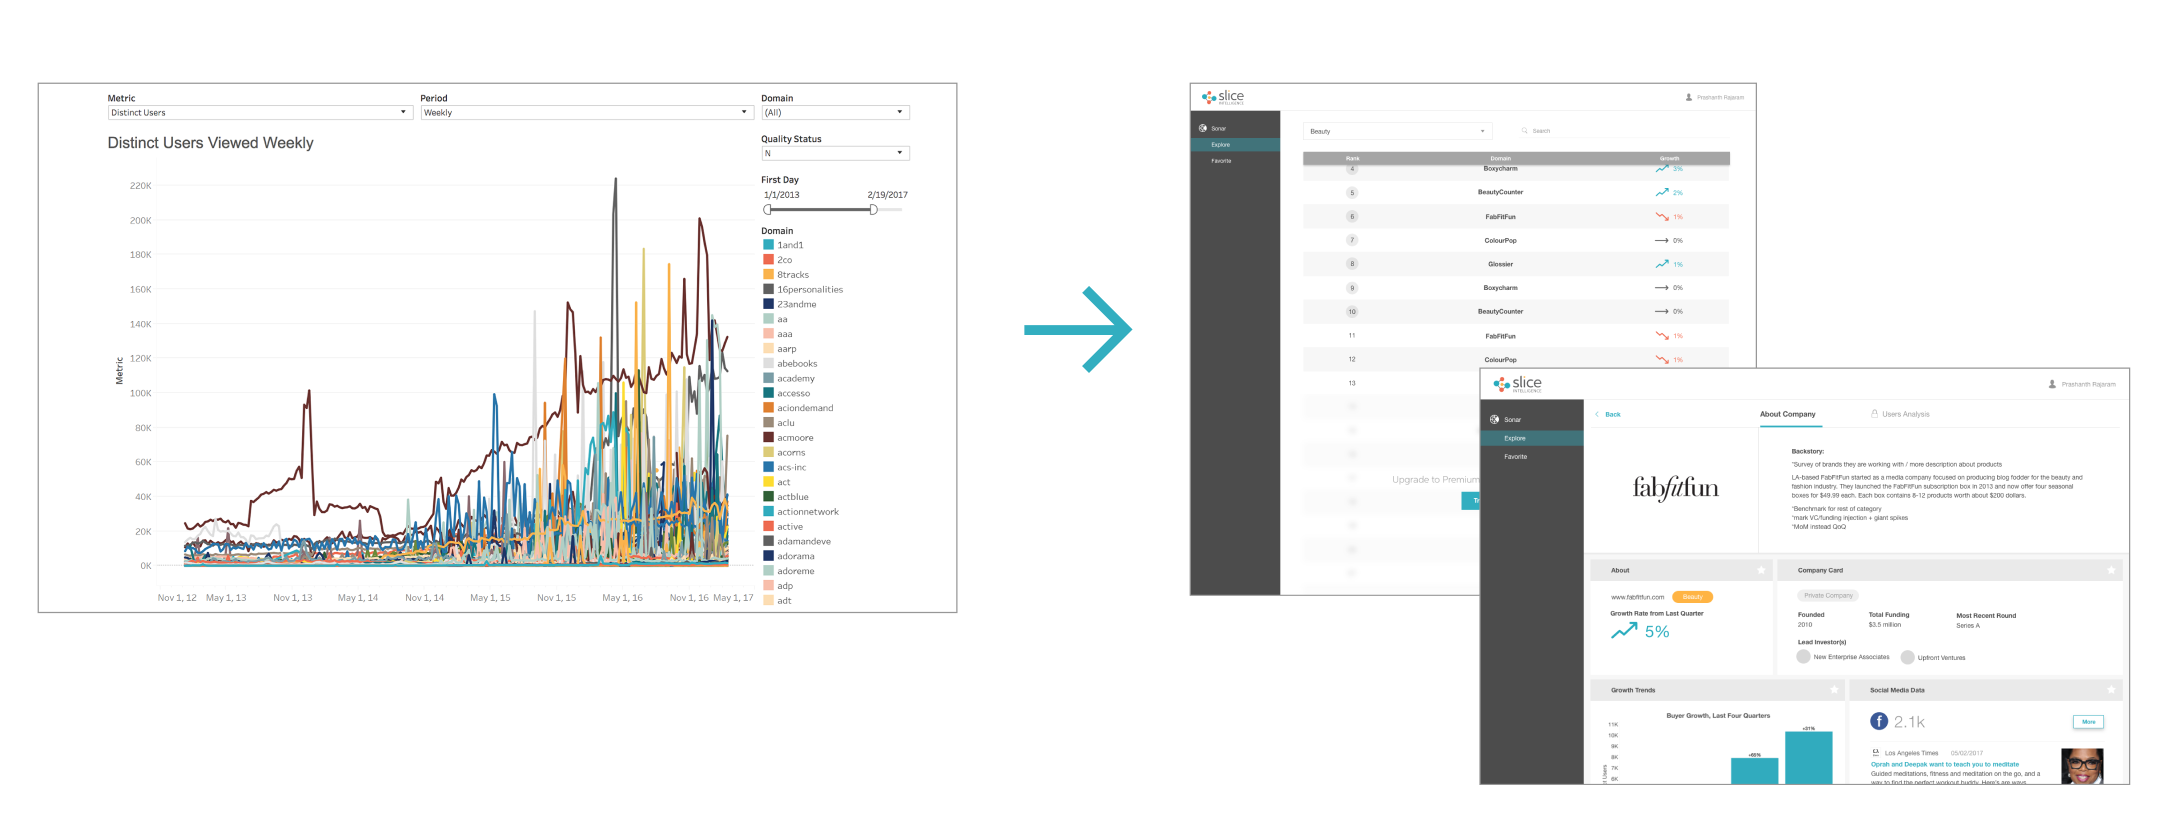
Left: Dashboard / Right: Company Overview
Opportunities
Scalable products: in the past our offerings were limited to custom reports which required costly Analyst human support. Our clients’ only engagement on our platform was to review and download the reports.
Solution for clients’ “we don’t know what we don’t know”: previously the market research reports were limited to the analysis about the known competitors. There was no easy way to discover the upcoming players outside the radar.
Data to Prototype
To validate the concept, we started with a Tableau chart showing the raw “Distinct User Count“ data, which clients recognized as a promising proxy for revenue performance. Prototypes and user flows were then refined through multiple rounds of client interviews.
From v1 Tableau prototype to v2 design prototype
Target Clients
We started with 2 types of assumptive clients: Big brands/retails and Investors. Then we learned the best potential client would be smaller Financial Service firms who invested new business whose annual revenue ranged $2M to $10M.
Scoping MVP
The learnings from initial interviews helped us define the MVP requirements:
1. Domain/company search: Clients wanted to explore any domain of their interest.
2. Notifications: Clients wanted to be notified which companies to look out ASAP
3. More data: Clients needed more data to learn about the upcoming companies
4. Upsell: Some clients would like to dive deep into shopper behaviors (ex: first-time vs return, promotion motivation). Signals was not yet equipped to answer comprehensive analysis but our custom reports were.
Building MVP
Besides the user flow, one important business requirement was to determine where and how to upsell the premium content (red arrows in the flow below).
Principles
Customization: Each card/widget could be adjusted in size and location, and was also provided with different metrics or visualizations to display.
Scalability: A new analysis can be created as a new card
Flexibility: We built permissioning mechanism in many layers so we can customize a pricing package based on the client’s need (e.g. unlock X more categories, Y time periods, Z analysis cards)
Card structure provides the flexibility for customized user experience and monetization model.
Design Iteration process along the product journey
Demo
Below is a screen-recording of the product walkthrough.
Design Challenges
1. Biased data: Every dataset has its bias. Our panel was biased to East and West coasters. We use z-score to show the relative comparison values instead of raw data. We provide 3 benchmarks: Industry Average, E-commerce Average, and Competitors.
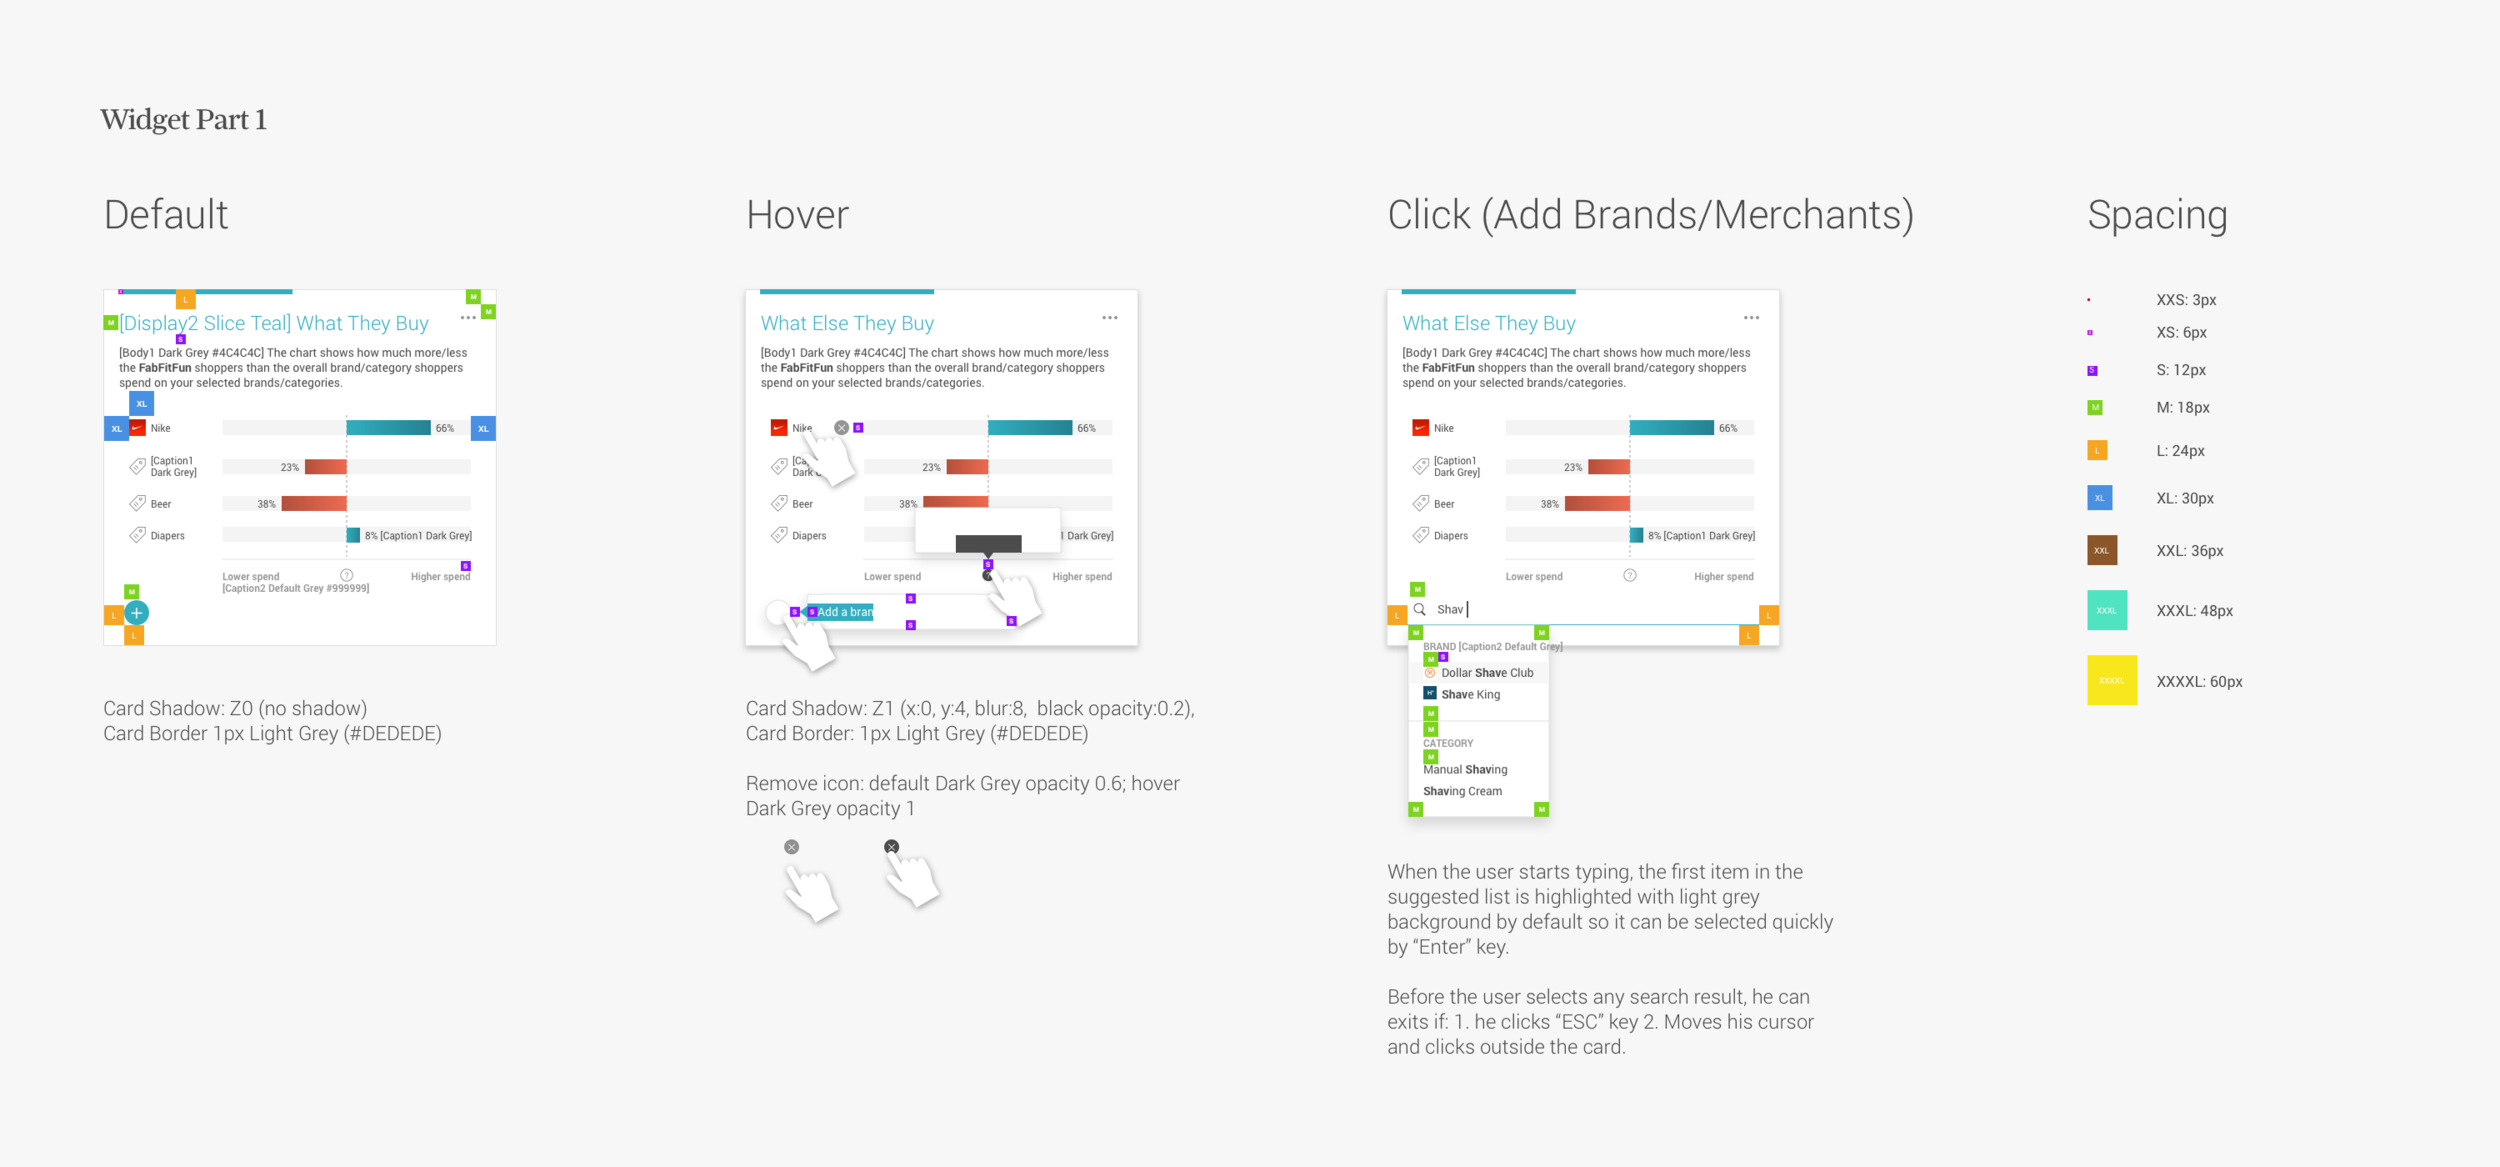
2. Customizable analysis: Advanced analysis cards “Where They Shop”, “What Else They Buy” and “Shopper Crossover” allow clients to add their own competitor list.
3. Terminology: We worked closely with Leadership, Marketing and Client Success to ensure all content writing is accurate and consistent with what we are offering.
Design System
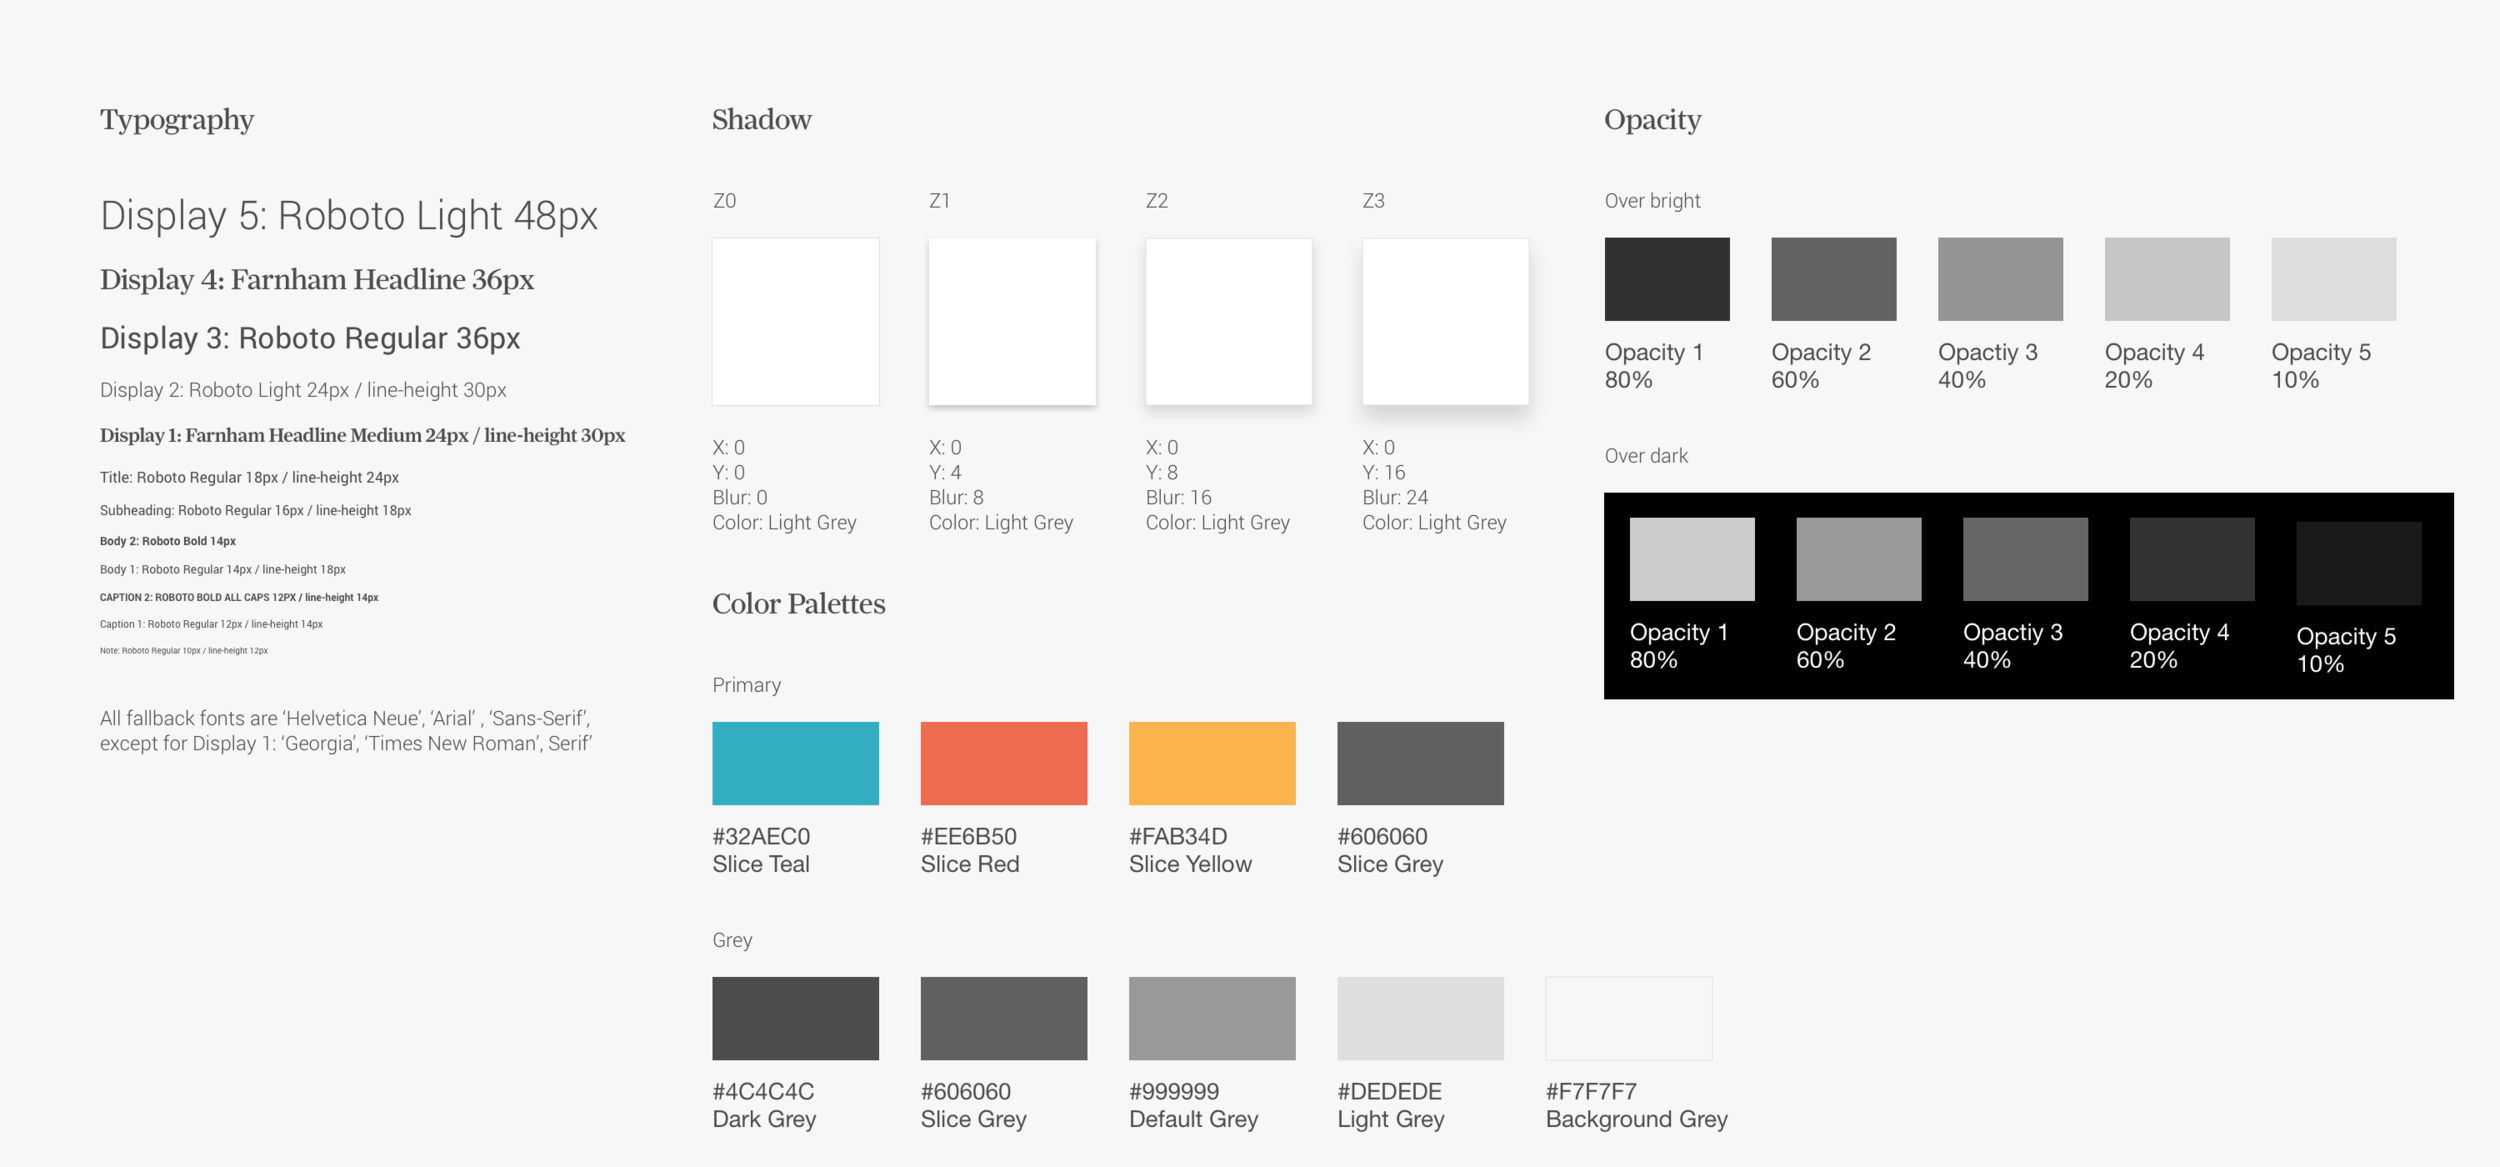
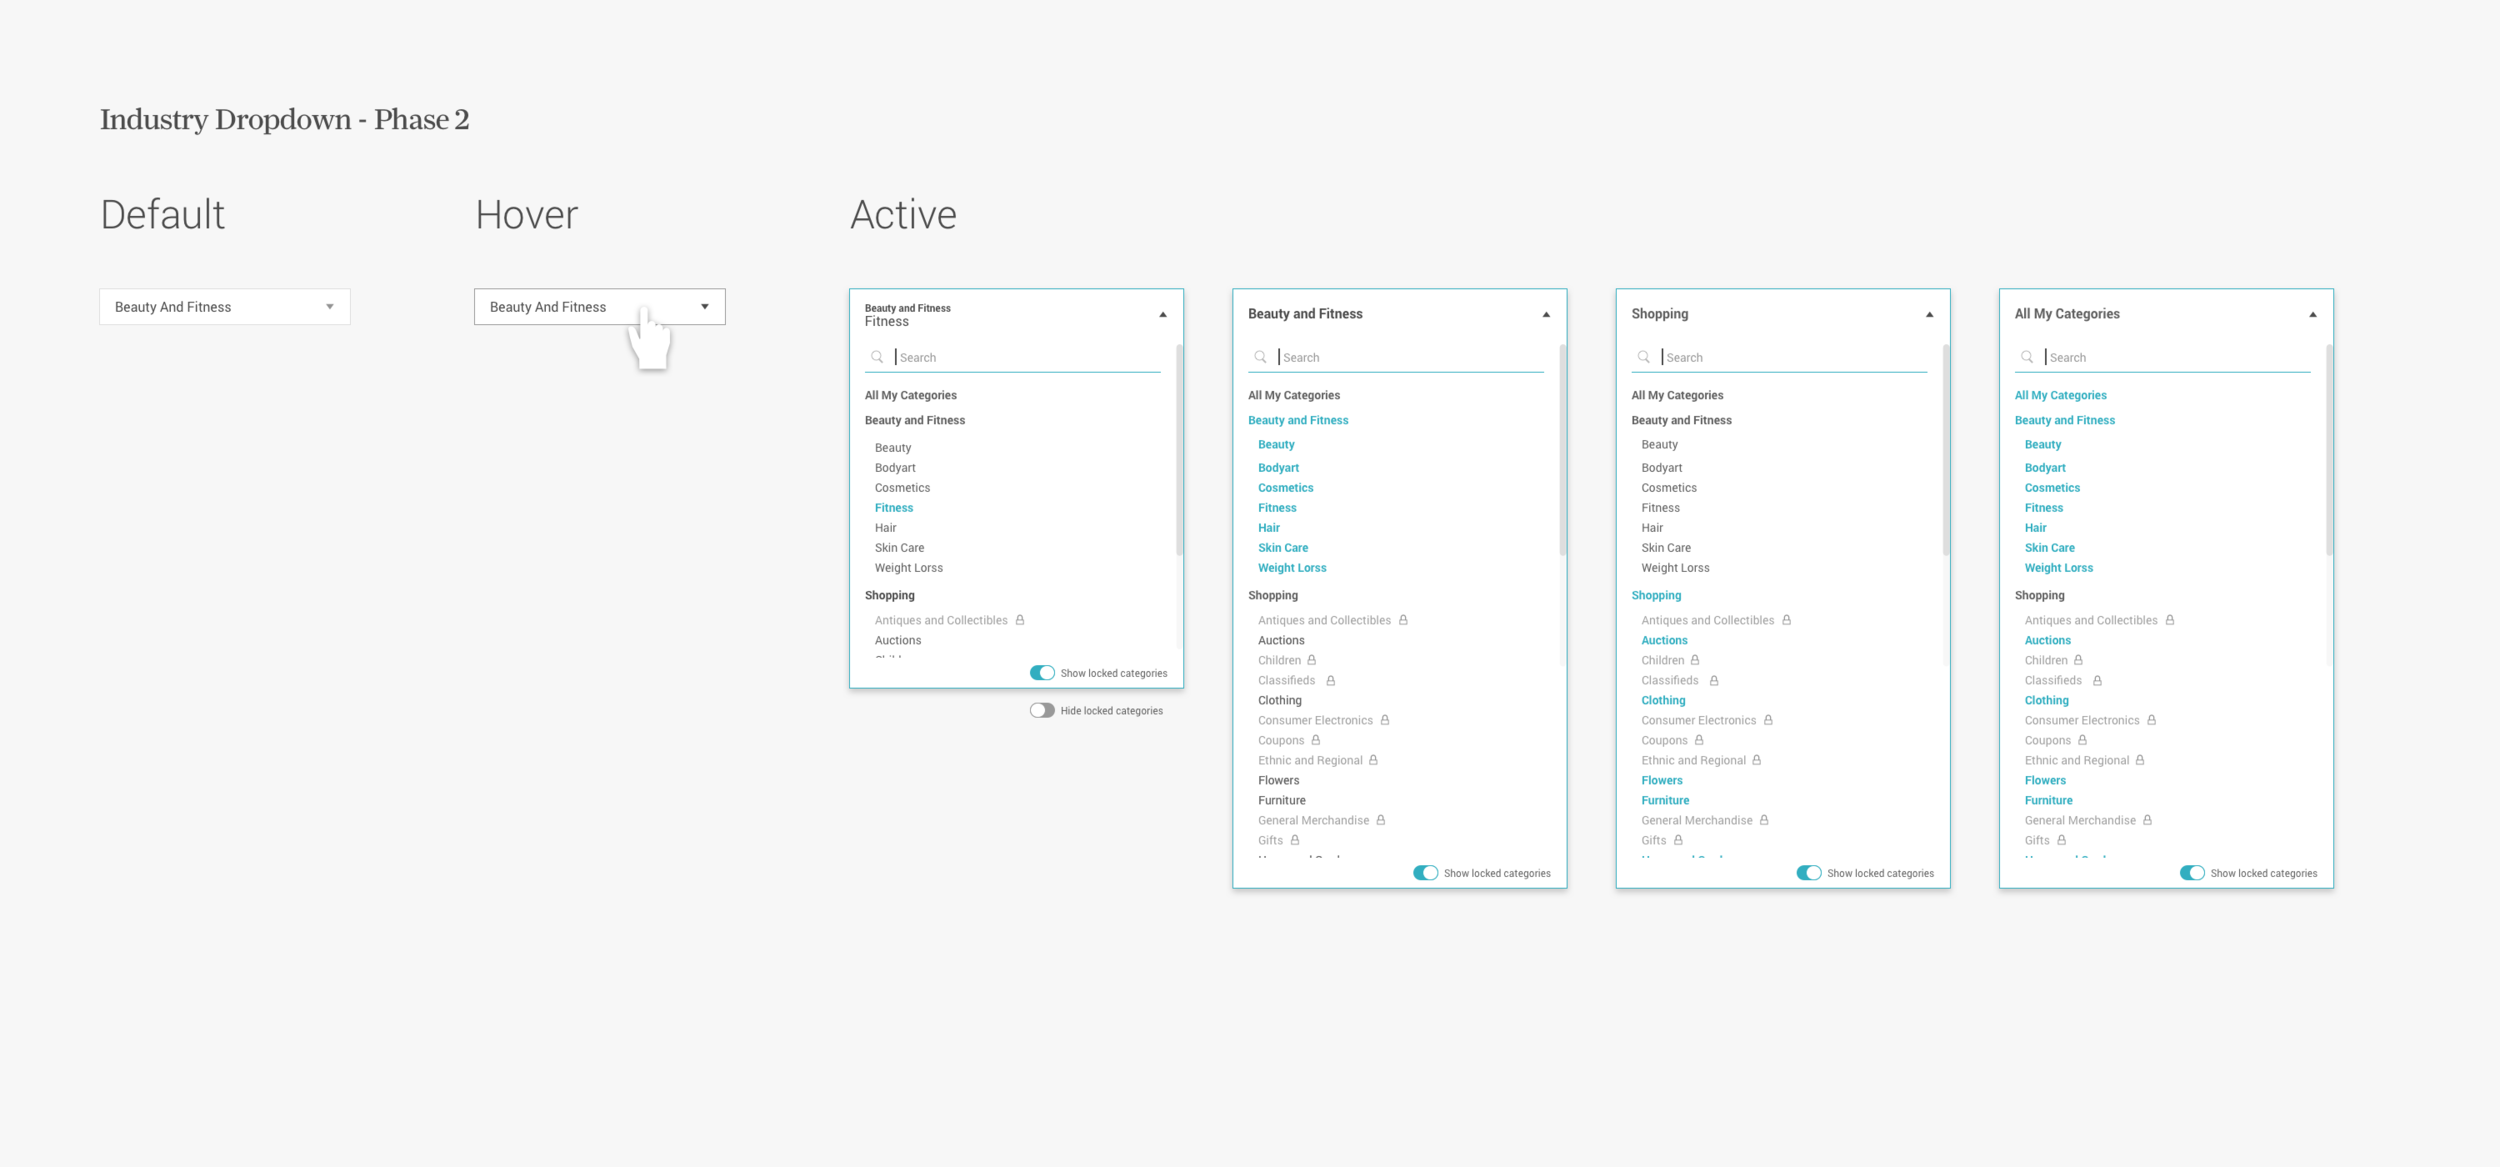
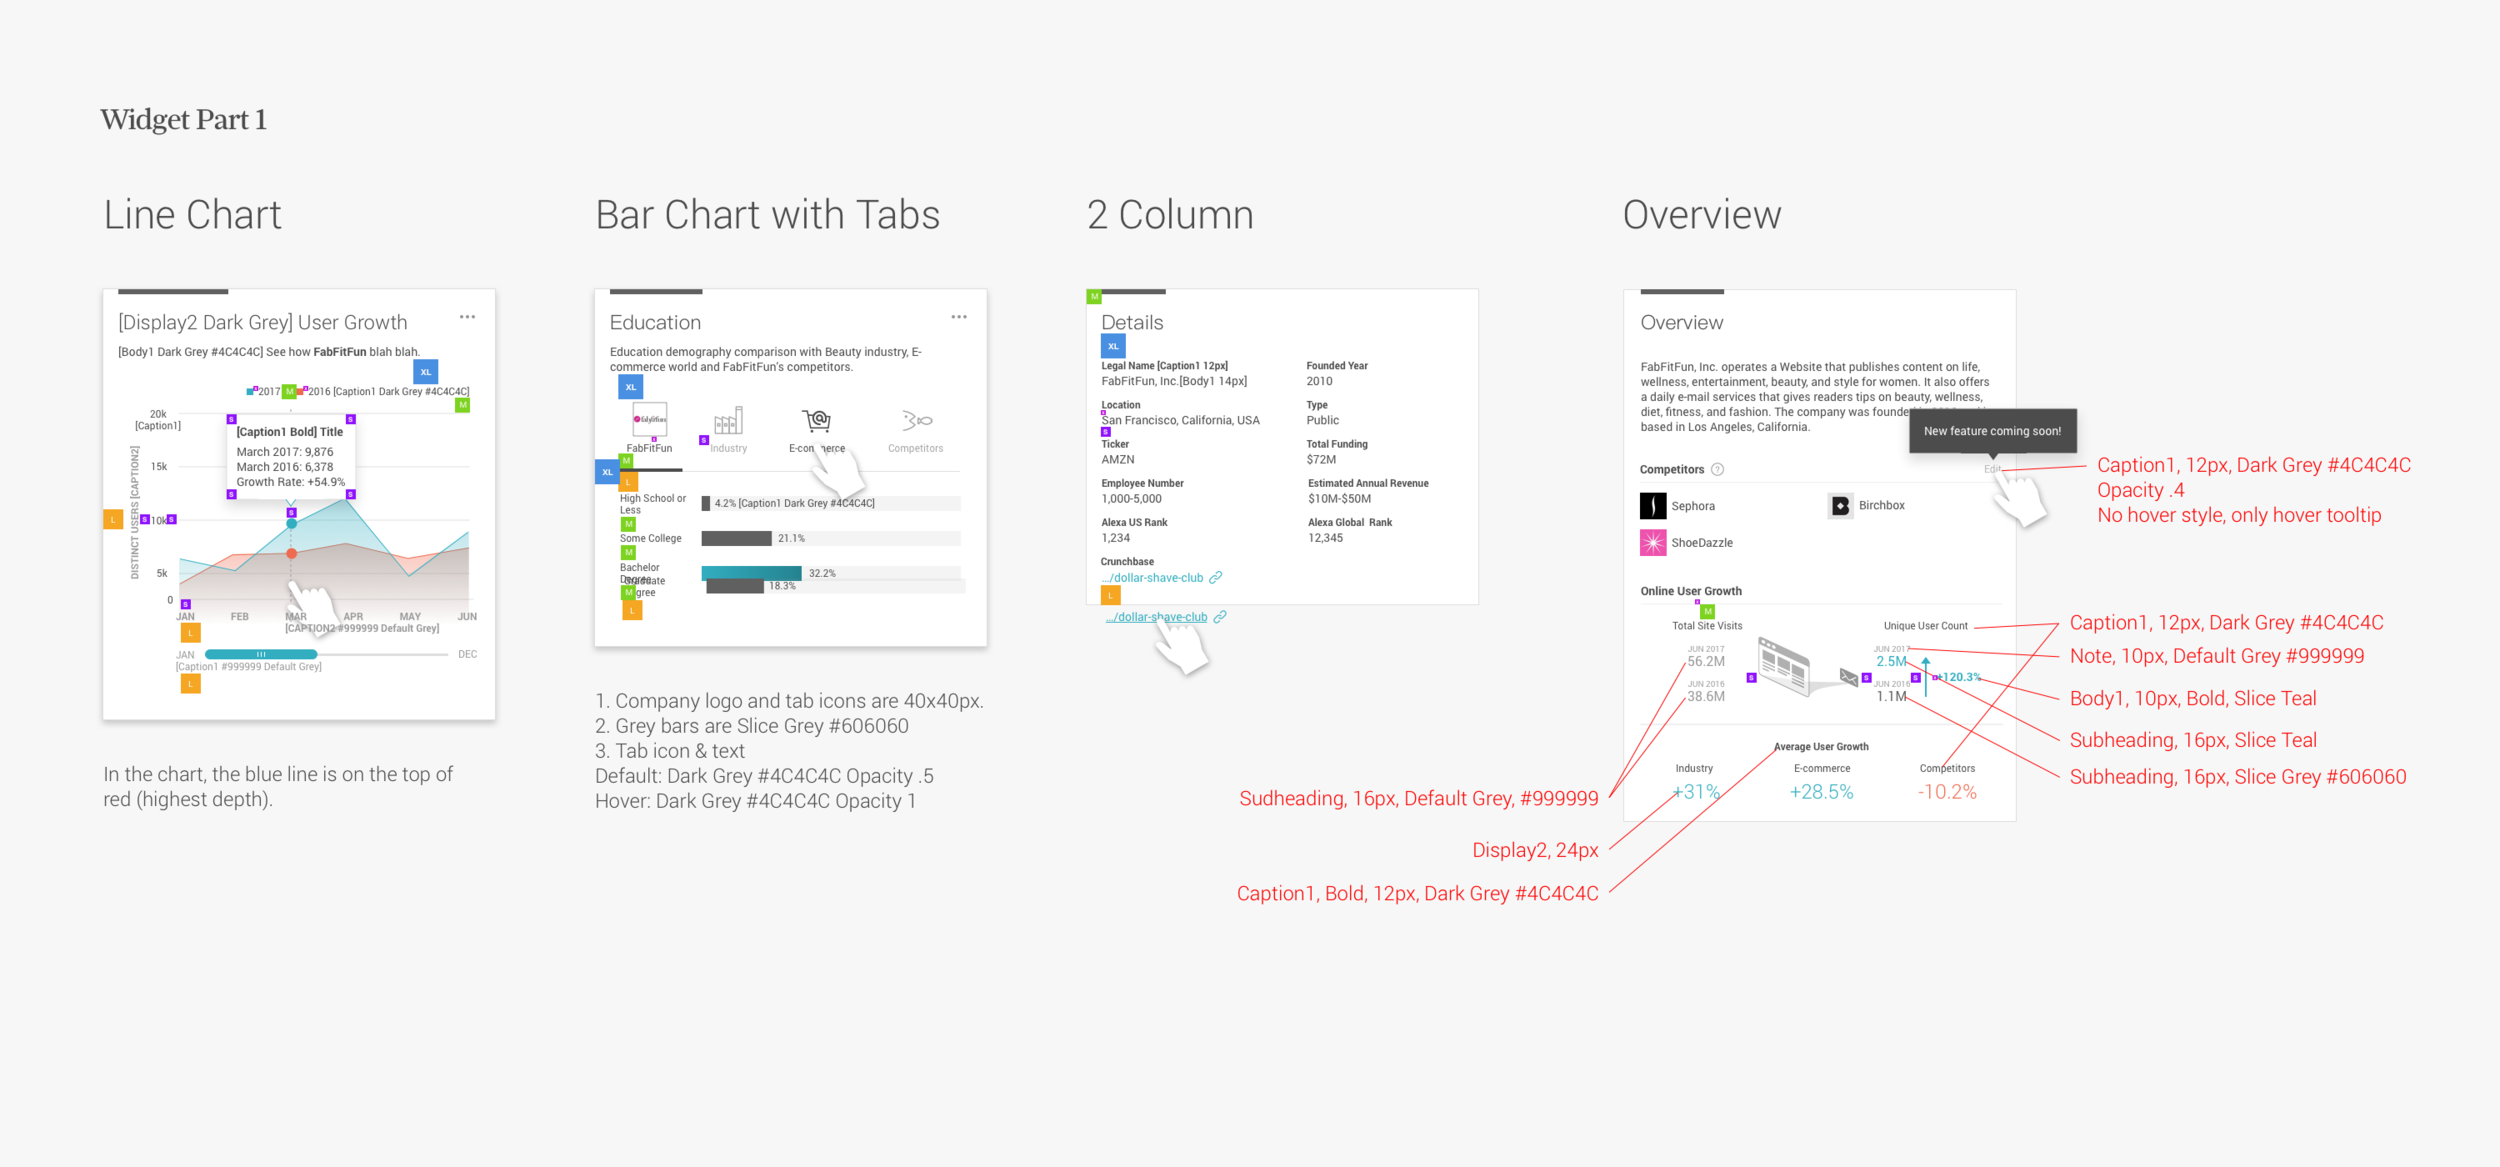
I led the team to build the first Rakuten Intelligence's design system from ground up. The process started from the basic elements: Typography, Color Palettes, Spacing, Shadow.. etc and then going up to components: Dropdown Menu, Input Field, Data Card..etc. Then we could put elements and components together to form templates: Widget, Table, Modal.. etc. The framework was based on Material UI and Highcharts library.
Marketing Strategy
We developed two case studies to demonstrate how Signals accurately captured business revenue growth, tailored for specific marketing purposes:
ShopTalk conference collateral: Showcased how Signals highlighted Marley Spoon’s differing revenue performance when partnering with Martha Stewart versus Amazon.
Marketing site: Created a lite version on the marketing page featuring Dollar Shave Club's data, allowing visitors to explore Signals' capabilities and gain insight into the comprehensive analysis Rakuten Intelligence offer.
Left: Conference collateral at ShopTalk / Right: Free lite version on Marketing page
Socializing
Outcomes
1. Signed the first client within 3 months: 7+ months improvement compared to Custom Report’s 10-month sales cycle
2. Inspired company’s next big idea: Signals set up a product process for bottom-up business initiatives. I facilitated a 2-week workshop to create the prototype for the next big bet “Atlas” (a logistics reporting) shortly after the Signals launch.
Next Steps
1. Better Algorithm & Visualization
MVP put all companies in a single table and it’s not a fair comparison. We need to:
I. Visualize a company’s growth path
II. Present a more fair and meaningful comparison between companies based on its size/growth stage
2. Product Features
Filtering and Watch List are the most common requests from the client feedback.

